Chart Analysis
- CHARTS
- Charts analysis are sent in a simple and effective way, with the intention that members can read and understand them easily.
Exemple below :
- MARKET SENTIMENT AND FUNDAMENTAL
- Keep in mind the factors that may have an influence on the market and therefore give it a direction.
- 3 TO 5 CHARTS ON A WEEKLY BASIS
- The number of trades depends on the opportunities that the market offers us. Trades are usually sent during the European and American sessions.

ARTEM goes over, and beyond the average groups for the following reasons :
– Share my vision on the financial market, fundamentally and technically.
– Tune the technique to the fundamental, analyze the different economic situations to get an idea of the currencies to focus on.
– Wait for opportunities to arise and not create opportunities that do not need to exist.
– Keep it simple, use the tools at our disposal that offer us market entries in the direction predefined by fundamental and market sentiment.
– Optimize winning trades by adding positions when the opportunity shows up and conversely, knowing how to exit a losing trade if there is nothing more to confirm a certain direction.
– Artem is a service focusing on day trading and from time to time swing trading, several T/P (take-profit) will be offered based on what the market offers us. S/L (stop-loss) will also be transmitted, to allow correct risk management.
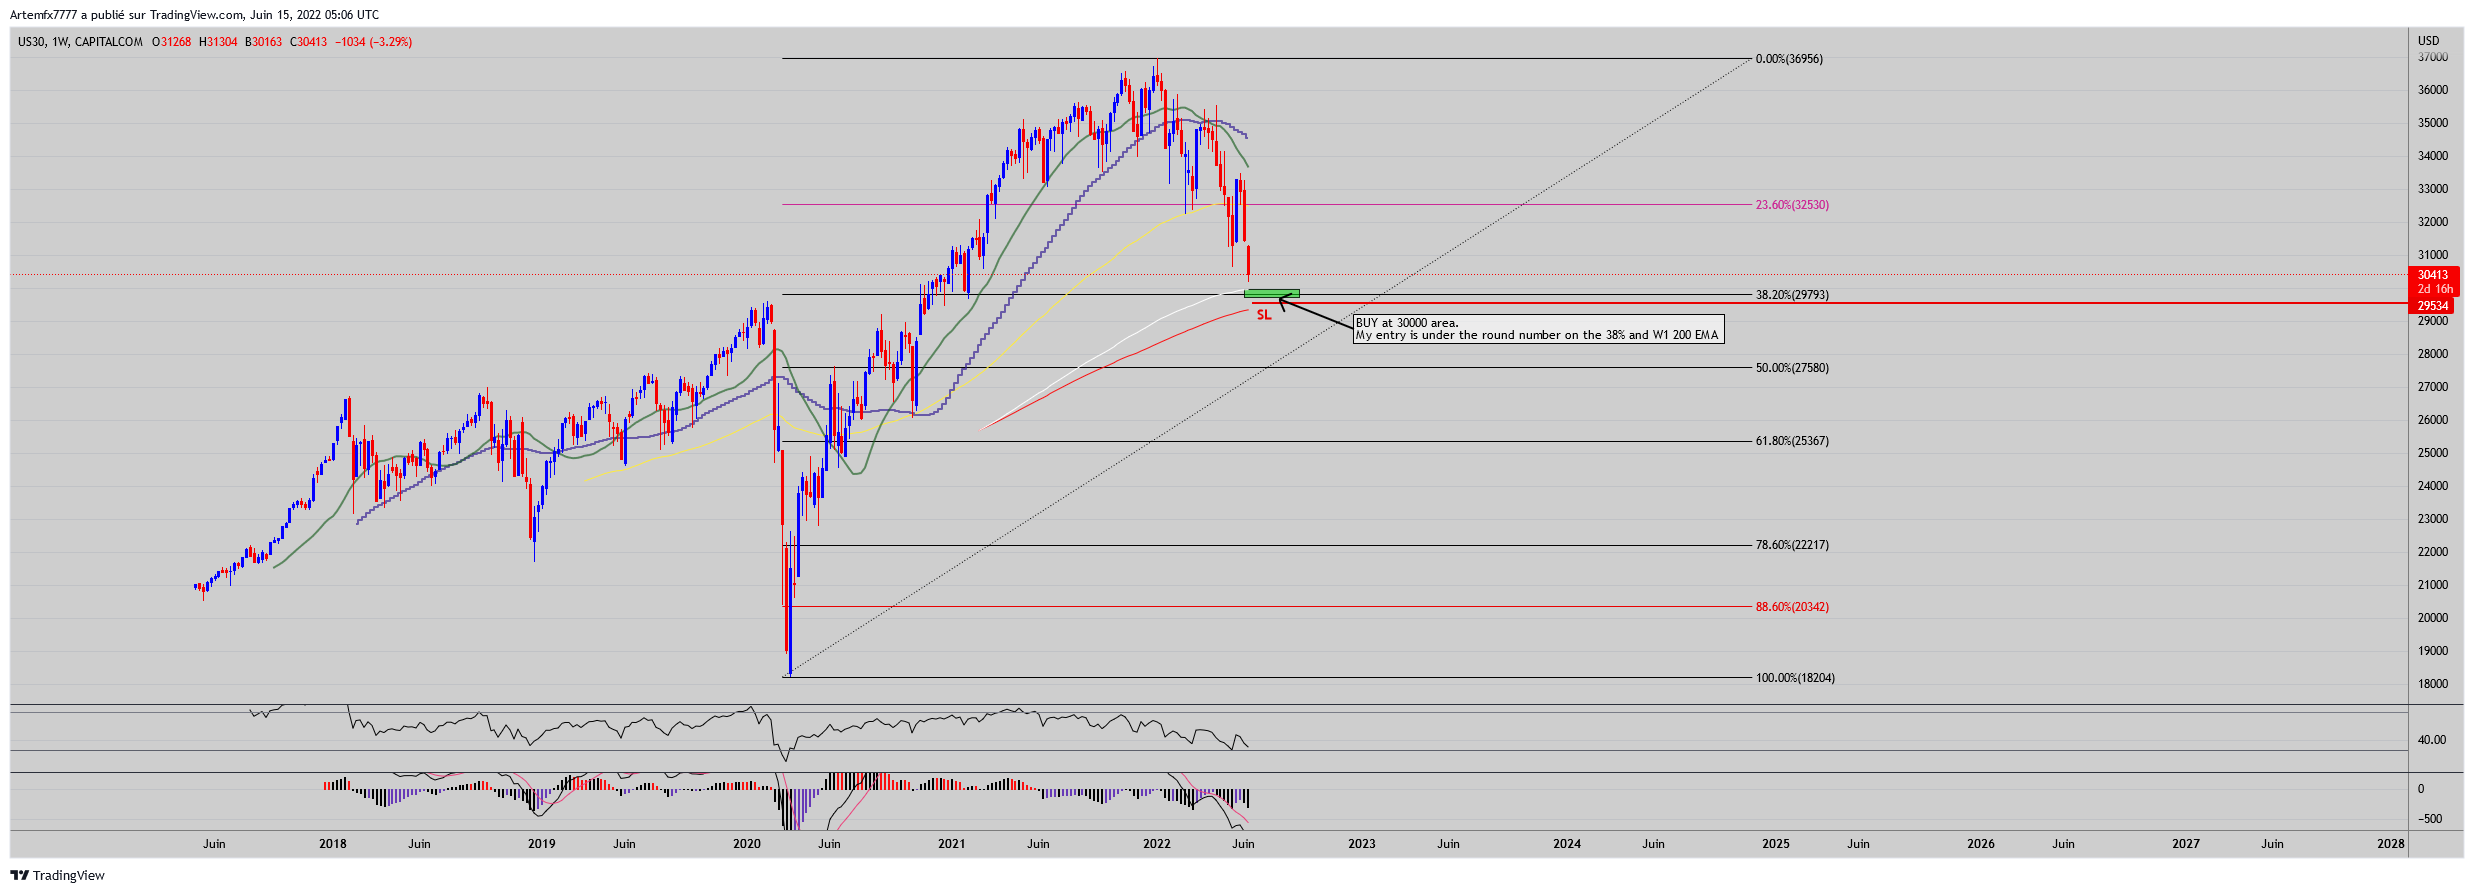
First, the trades are sent in this way, with a GREEN area for a BUY or RED for a SELL, on this example on US30 we can see the zone of BUY accompanied by the delimitation of the SL for this trade which was a long-term position with subsequent additions of positions in the direction of the trend.
Or, the trades are sent with a Risk/Reward Ratio to define entries, the SL and the various TP’s with the risk exposed.
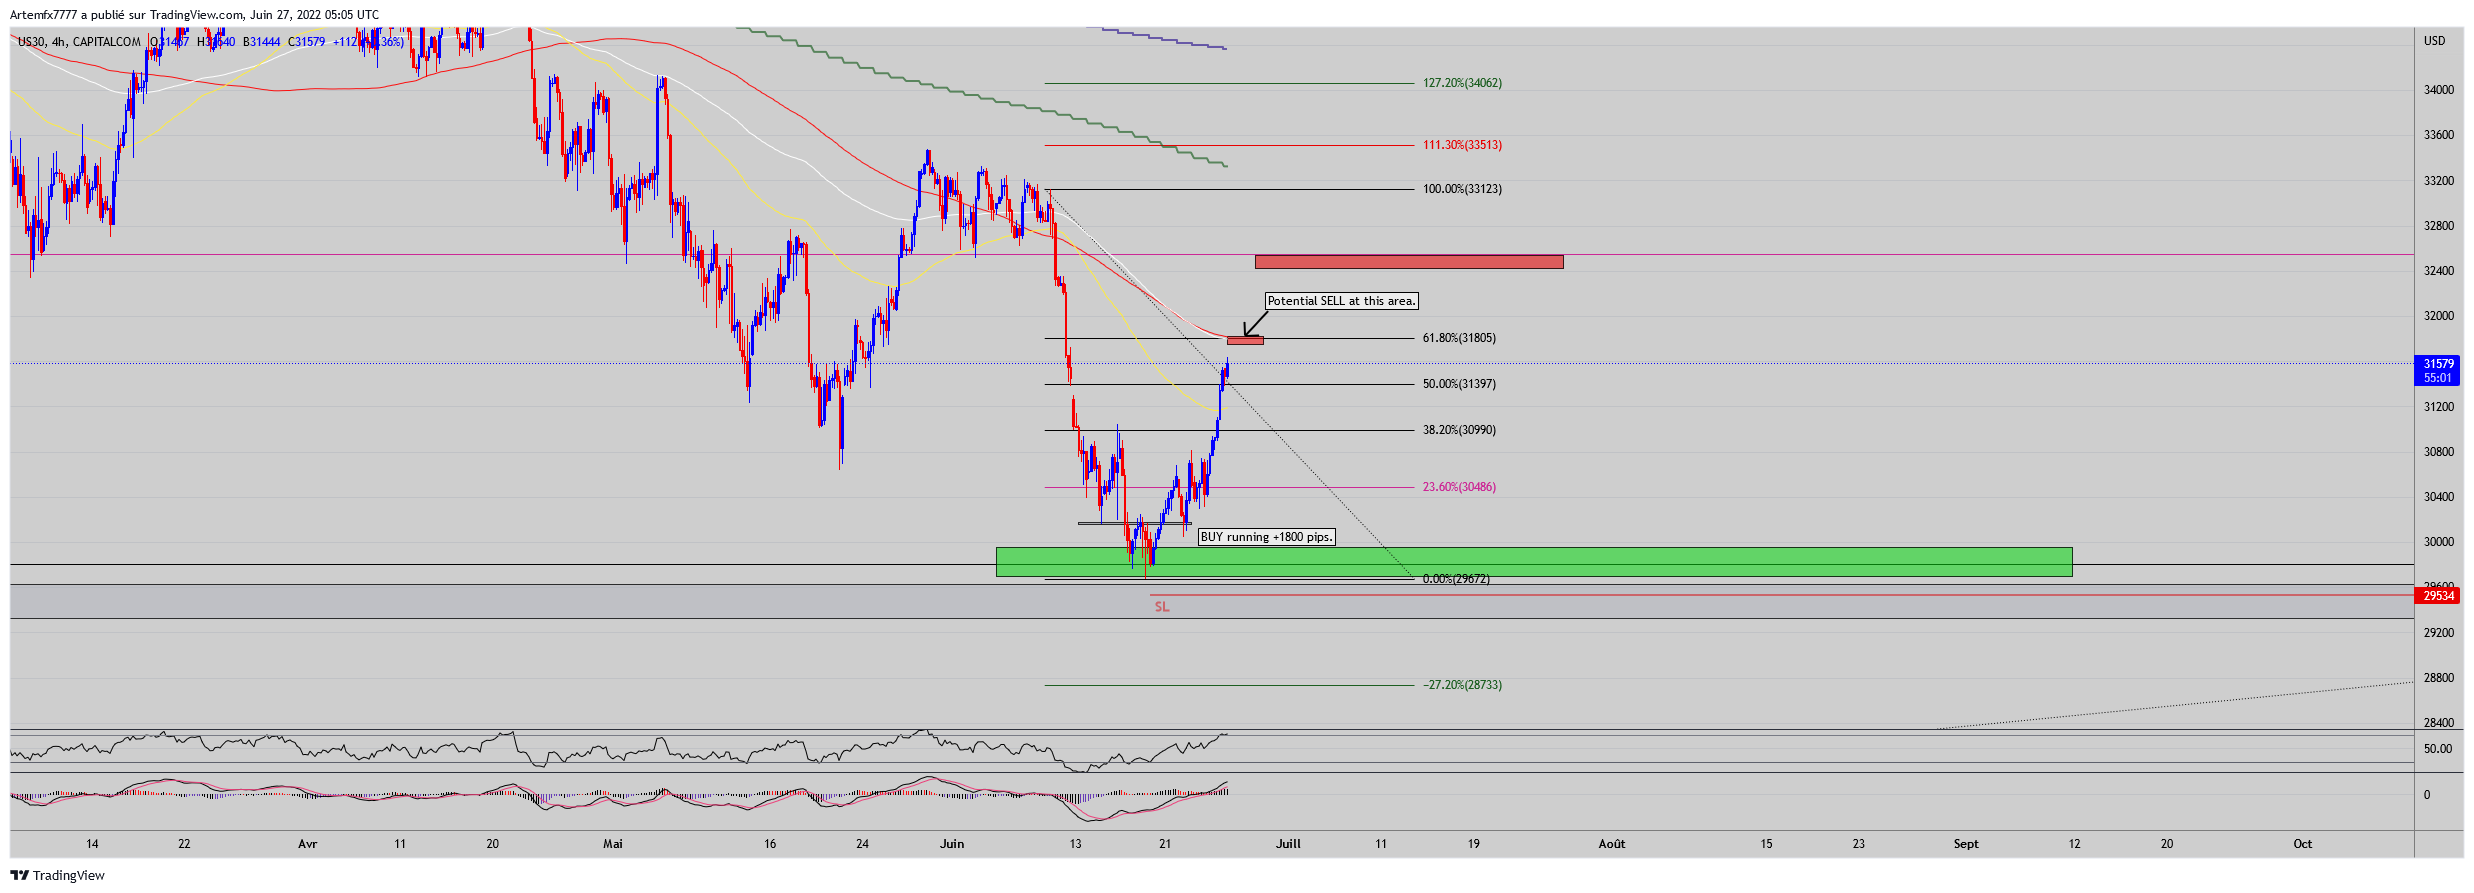
Then, the second image represents the follow-up of the trade with also a text sent in the group in support which we do not necessarily see here.
Regardless, this explains how to manage your trade as efficiently as possible, as I said before we add trades in the direction of the trend but if the trade is positive with secure profits it is also possible to take an opposite position to the one we hold.
In the end, it’s only benefit if it is used with the correct Risk Management.
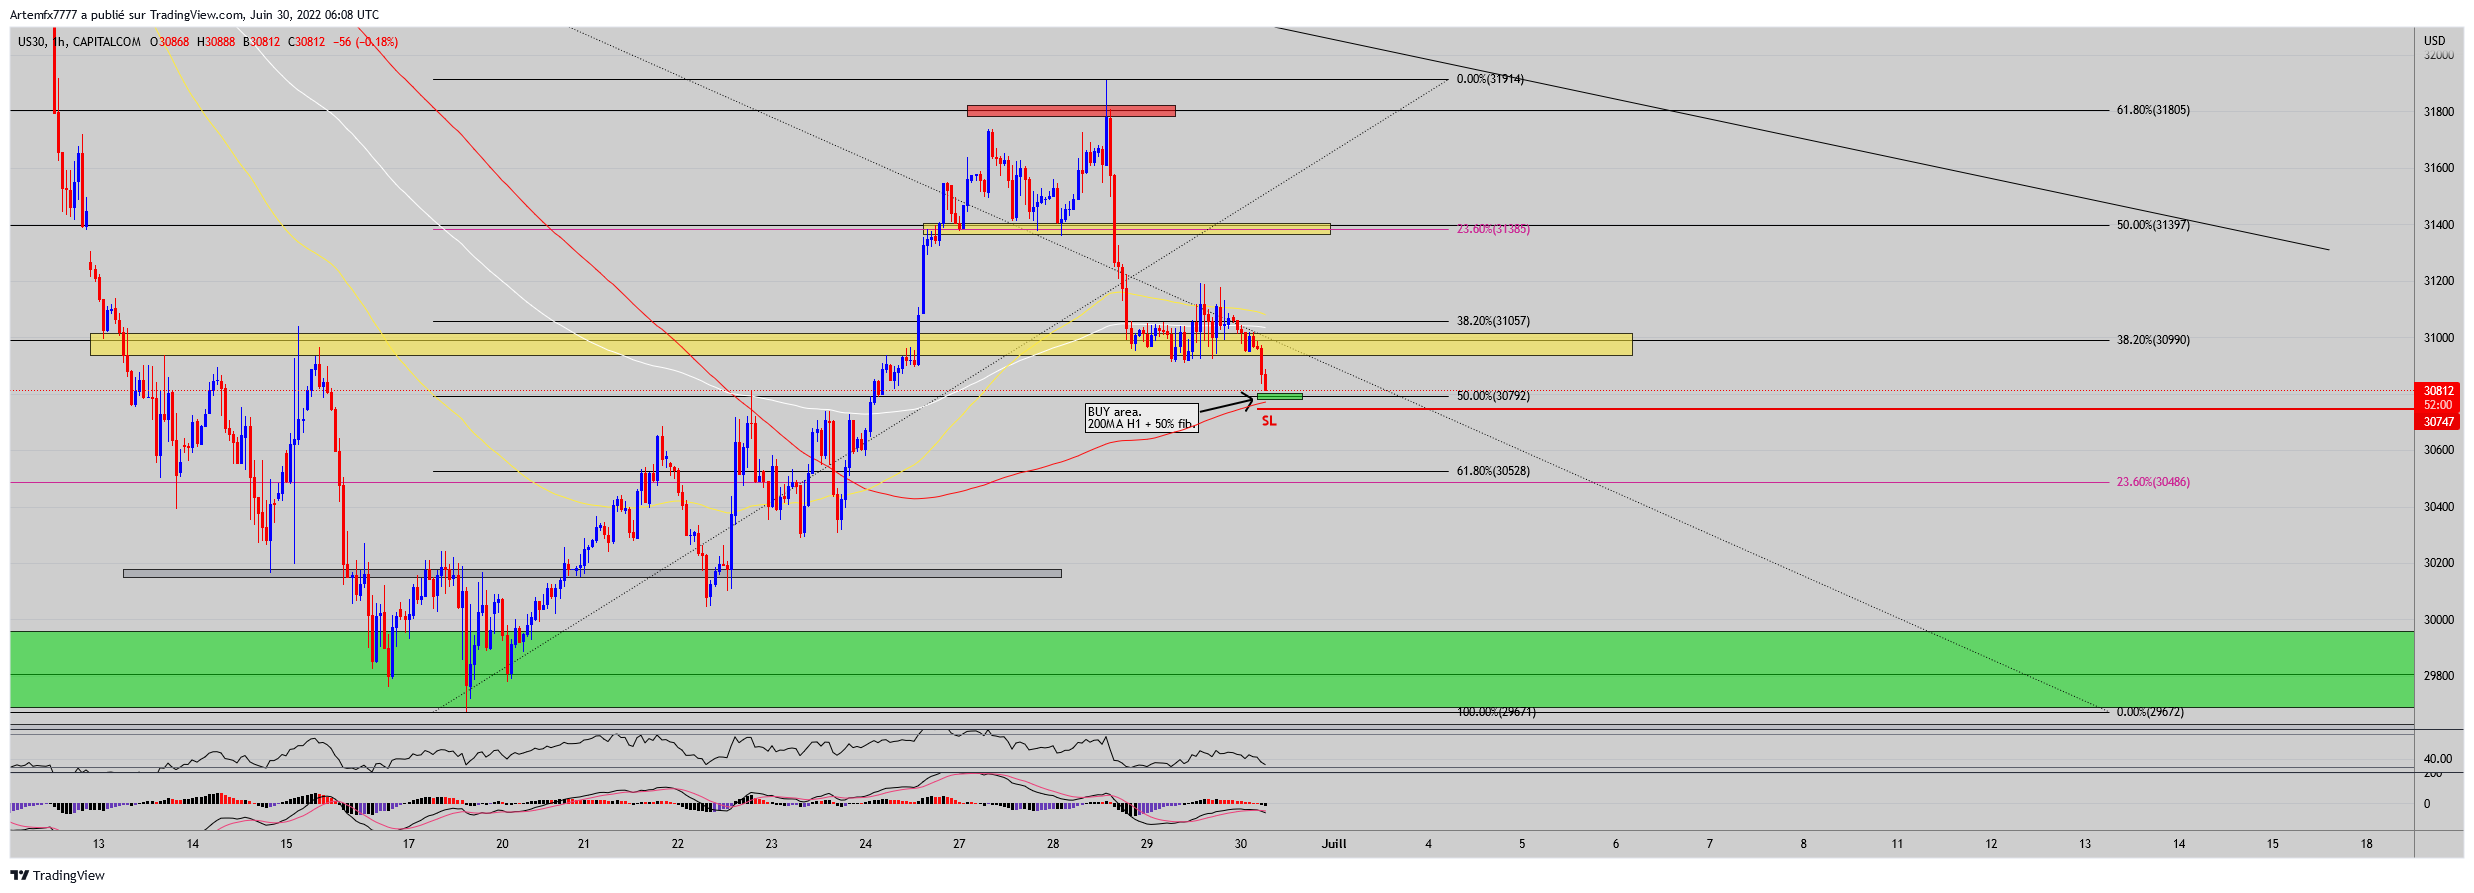
Finally, as we can see, the SELL was a success which will now allow us to exit to consider adding a position on the initial BUY.
Counting the total number of pips at the end of this pattern we have over 3000 pips in profit.
( This trade is in my free group on telegram )
- Average of 4 to 5 charts per week depending on the market condition.
- Trades are sent in the form of a readable chart both for beginners and for more experienced traders.
- Trades are mostly sent during European and American sessions.
- Entries, stop-loss and take-profits positioning + trades updates.
- Tips and tricks on Trading on a weekly basis.
- Average of 4 to 5 charts per week depending on the market condition.
- Trades are sent in the form of a readable chart both for beginners and for more experienced traders.
- Trades are mostly sent during European and American sessions.
- Entries, stop-loss and take-profits + trades updates.
- Tips and tricks on Trading on a weekly basis.
- Group chat, members can ask questions related to Artem’s trades and their own ideas on the financial market.
- Sundays breakdown on the current week and trades analysis post for the coming week to know what we’re gonna focus on.